Tagged : north vancouver real estate stats RSS Feed

Found 20 blog entries tagged as "north vancouver real estate stats".

Decade low inventory levels across all property types ignites an aggressive real estate market in Vancouver. Whether you're looking for a detached home, townhouse or a condo, chances are you'll find yourself in multiple offers so be prepared.

After a record setting 2015 where home sales were the highest in REBGV history, we're headed for a strong 2016. January sales are up by almost 32% compared to January 2015 and new listing inventory is down by 6%.

“Fundamental economics are driving today’s market. Home buyer demand is at near record heights and home seller supply is as low as we’ve seen in many years,” Darcy McLeod, REBGV president said.

If you’re contemplating a purchase this spring/summer it might be a good idea to start looking now to…

5,357 Views, 0 Comments

Wow... the highest number of detached sales in North Vancouver for February since 2002. Yep, I said 2002. There were 124 detached sales in February 2015 compared to 94 in 2014 and 137 in 2002. The least number was 46 in 2009. Coupled with low inventory, relative to the level of demand, multiple offers are commonplace in both North and West Van for detached homes, now trickling into the townhouse and condo markets as well.

However, not EVERYTHING is selling for higher than the asking price. The detached market saw 57 out of 124 homes selling at or over list price (from 3k to 160k); townhouses 25 out of 53; and apartment condos saw 31 out of 94. 

“It’s an active and competitive marketplace today. Buyers are motivated and homes that are priced…

7,398 Views, 0 Comments

Multiple offers are back in play as the North Vancouver real estate market experiences low detached inventory. There were 134 sales in March, which is up by about 19% over the previous year while listings are down by 21%. Due to the shift in supply and demand, 41 of those properties sold for asking price or, more commonly, over asking price. The busiest neighbourhoods being Lynn Valley with 8 and Blueridge with 5. Canyon Heights, Forest Hills, Central Lonsdale and Westlynn were also popular.

The West Vancouver market had a very different experience where only 9 of 62 detached sales resulted in multiple offers however, prices continue to rebound and are up by 6.8% over last year and 1.7% over last month. While condos prices are down by -1.6% over last…

5,639 Views, 0 Comments

In North Vancouver prices are up across all property types this February compared to last. Detached by 2.6%, townhouses by 0.6% and condos by 1.3%. West Vancouver notably experienced a 7.2% increase in detached pricing.

Sales in North Vancouver are up considerably as well with the most significant being townhouses by 47%, condos by 36% and detached by 26%. In saying that, we've noticed a large number of sales being posted over the last few weeks for single family homes so I would expect this number to bump up for March. 

Supply is generally down... buyers in the detached market don't have as much to choose from which is unfortunate. If this trend continues as more purchasers enter the real estate market this spring, we will see an upward pressure…

11,162 Views, 0 Comments

In North Vancouver prices are up by approximately 4% across all property types this January compared to last. While detached sales remain relatively unchanged, North Vancouver attached sales have increased. Apartment sales are up 32% and townhouse sales are up 12% over January 2012. We've also noticed in these early weeks of February that sales on new listings are happening more quickly... and that even 60 - 120 day old listings are starting to move. 

Now let's talk inventory. The total number of detached listings is down by 23.4% compared to last January and townhouse listings are also down (by 17%). This would be why those 'older' listings are starting to sell as more buyers enter the real estate market in these early stages of spring. On the flip…

7,425 Views, 0 Comments

Throughout 2013, the North Shore housing market maintained a consistent balance between supply and demand. This resulted in modest price and sales increases. While we didn't see record-breaking sales months as we have in past years, it was definitely a stronger market in 2013 compared to 2012 where the market peaked in April and ended on a less than stellar note. This year, however, North Vancouver prices are up over last December and so are sales, with the exception of townhouses.

We didn't really see too much of a slow-down in December and were still showing properties as late as Christmas Eve! Buyers definitely remain on the lookout. 

North Vancouver detached home prices are up 4% over last December, condos are up by 3% and townhouses by…

3,006 Views, 0 Comments

While pricing remains unchanged, North Vancouver real estate sales are up (again) by 38% over last October. Specifically detached sales are +35.6%, attached sales are +56%, and condos sales are +35.1%. West Vancouver is seeing the same trend, but their detached pricing increased modestly (+3%). WV detached sales are up by +56.9%, attached sales +450%, and condos sales +50%.

Let us know what you think of the new interactive graphs!


North Vancouver Pricing Index - Interactive Graph


North Vancouver Sales Index - Interactive Graph


West Vancouver Pricing Index - Interactive Graph


West Vancouver Sales Index - Interactive Graph


4,154 Views, 0 Comments

North Vancouver real estate sales are up by 58.8% over last September and listing inventory is down. Broken out it looks like this: detached sales +71.1% and inventory -21.3, attached sales +115.4% and inventory -20.0%, and condos sales +29.5% and inventory -10.0%.

So why haven't we experienced huge fluctuations in local home values over the past year? Well, prices didn't quickly and 'artificially' inflate like in some markets, plus it's important to consider that we're in line with the 10-year sales average. The real estate market held its own during a slow market and now we're seeing things gradually get back to normal. If anybody really knows what that means.

What's impressive is that our home prices didn't see a significant decrease through the…

4,511 Views, 0 Comments

Busy summer! Sales were well above average compared to 2012 and in fact, North Vancouver experienced the highest number of sales in July and August since 2009. Despite the extremely slow pace over the past year, prices have held steady. All time highs were reached in the spring of 2012, over all property types, in North Van and bottomed out in December and January. We've slowly been edging up almost every month since. 

Last July, CMHC changed many of their rules and regulations surrounding lending which changed the market almost immediately. In retrospect, it was like somebody turned the lights off. This year, the interest rate increase(s) along with CMHC's latest announcement that they will now (annually) cap the amount that they will insure each…

3,213 Views, 0 Comments

Sorry, folks. The last few months have been busier than what is typical for this time of year. Mainly due to interest rate increase, I would suspect as there has been considerable first time buyer movement in the real estate market. Please bear with us as we try to catch up on our stats...hopefully!

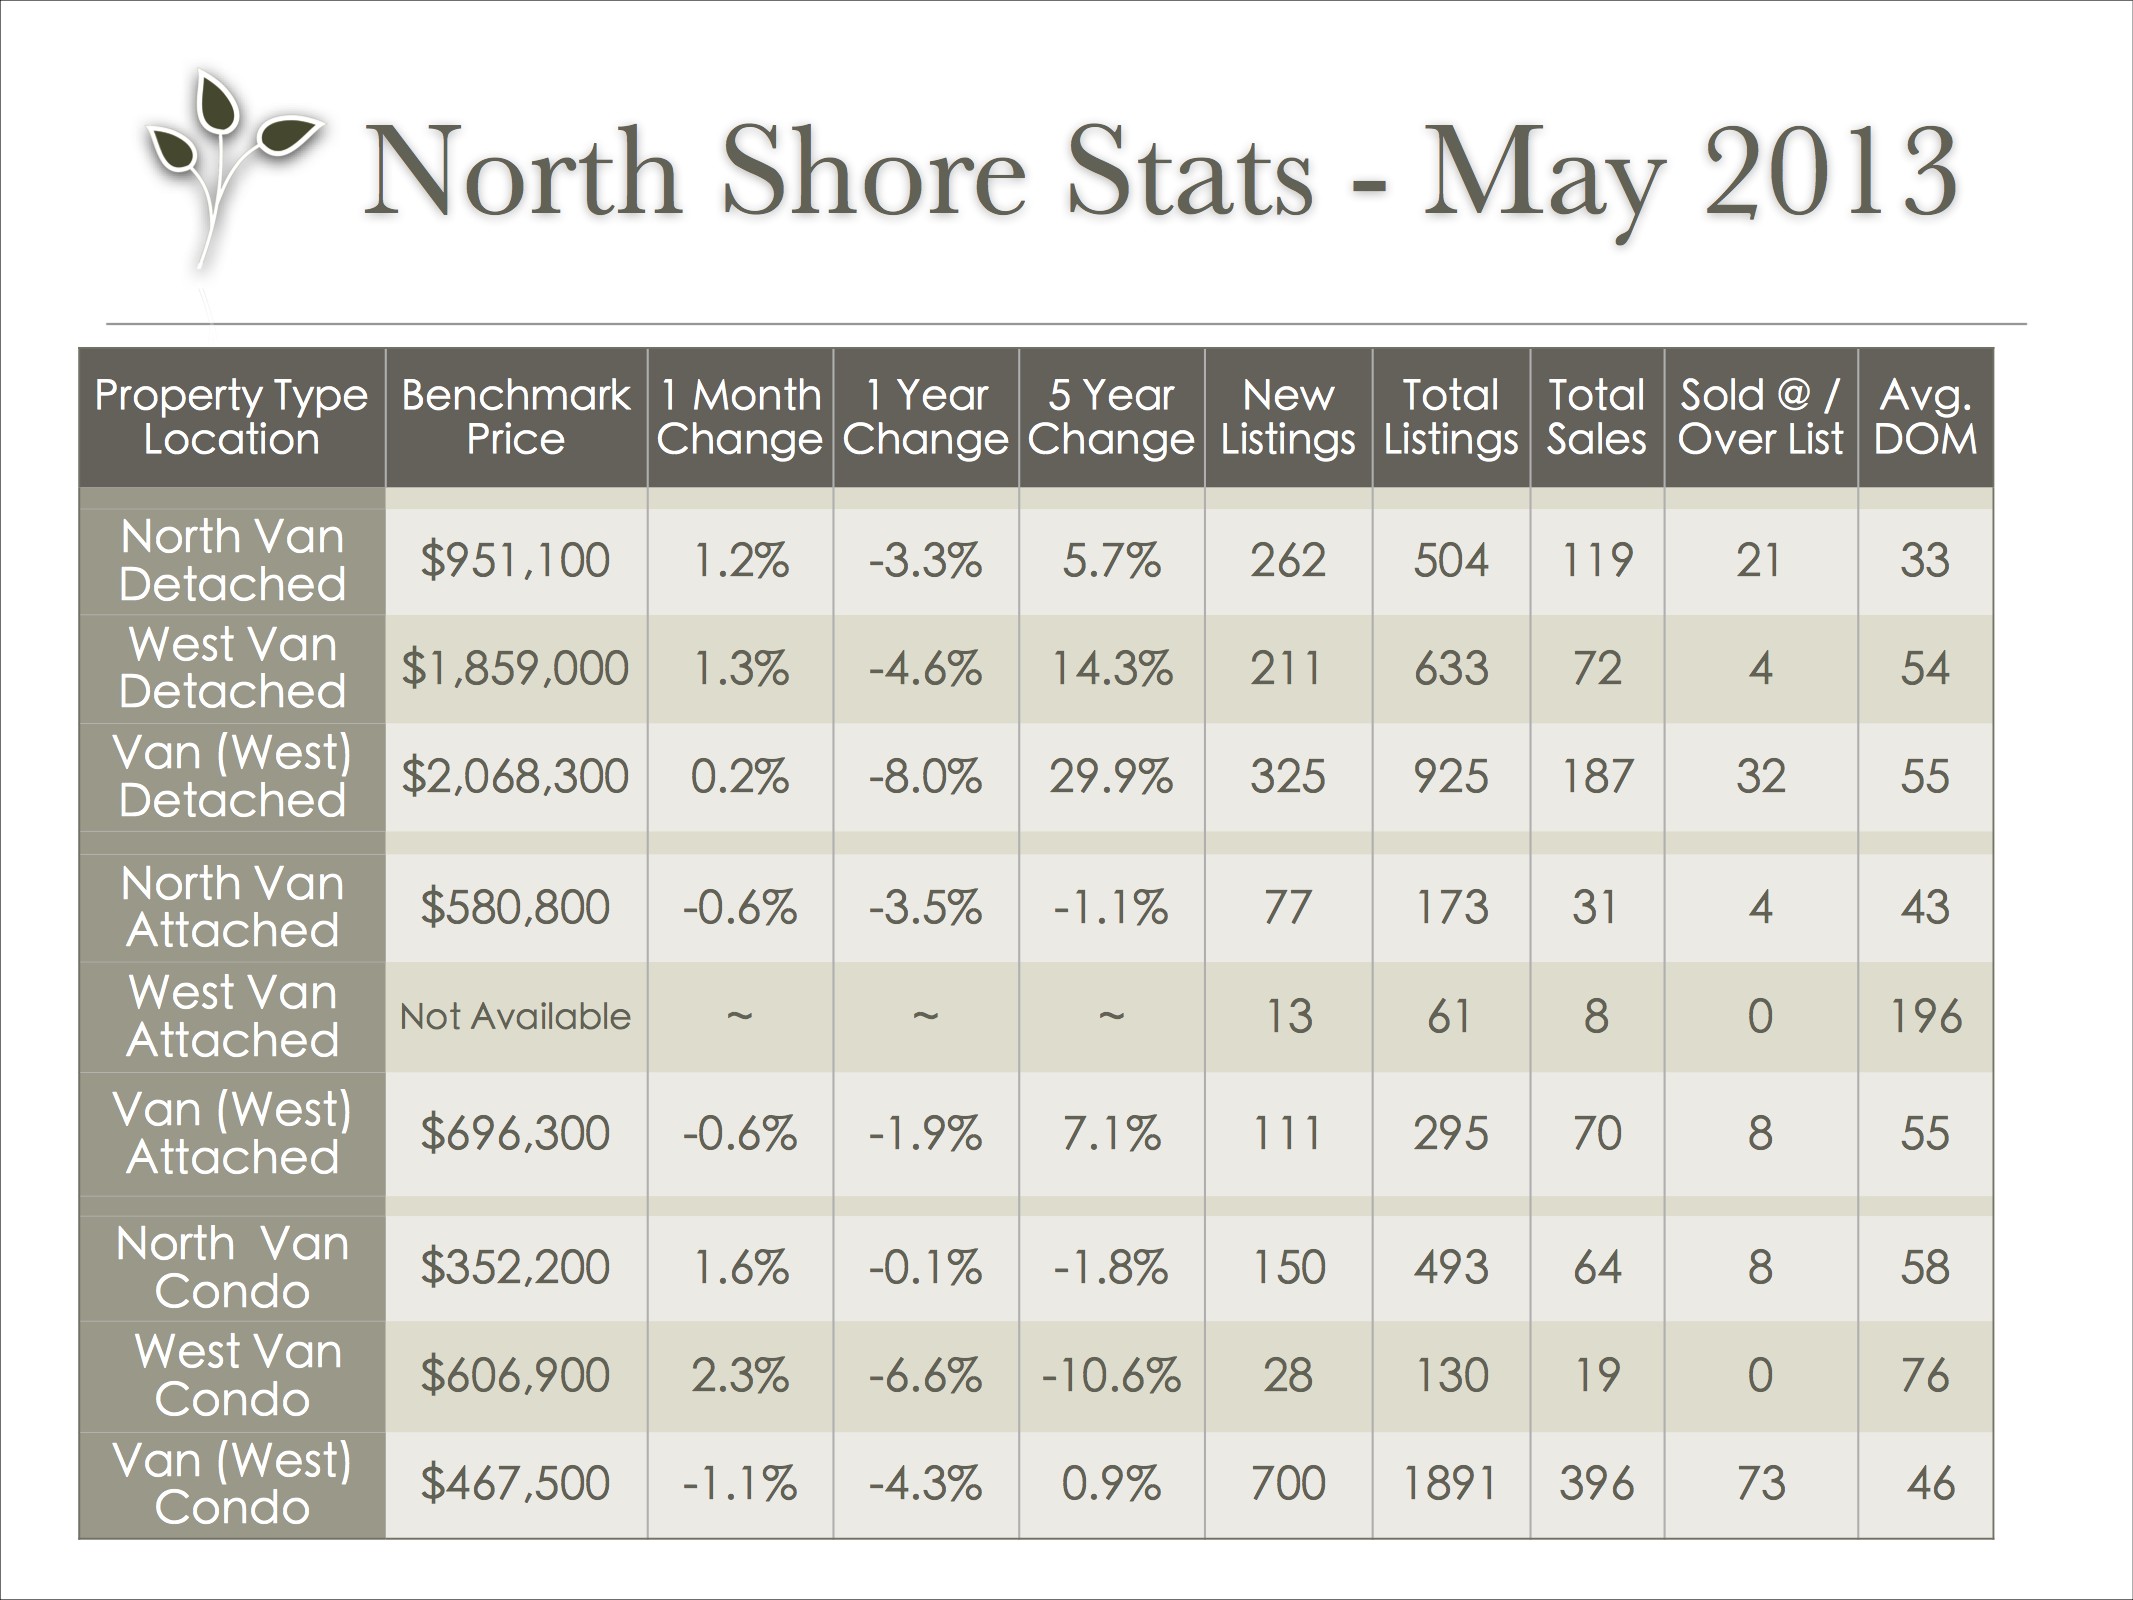
vancouver_stats_may_2013

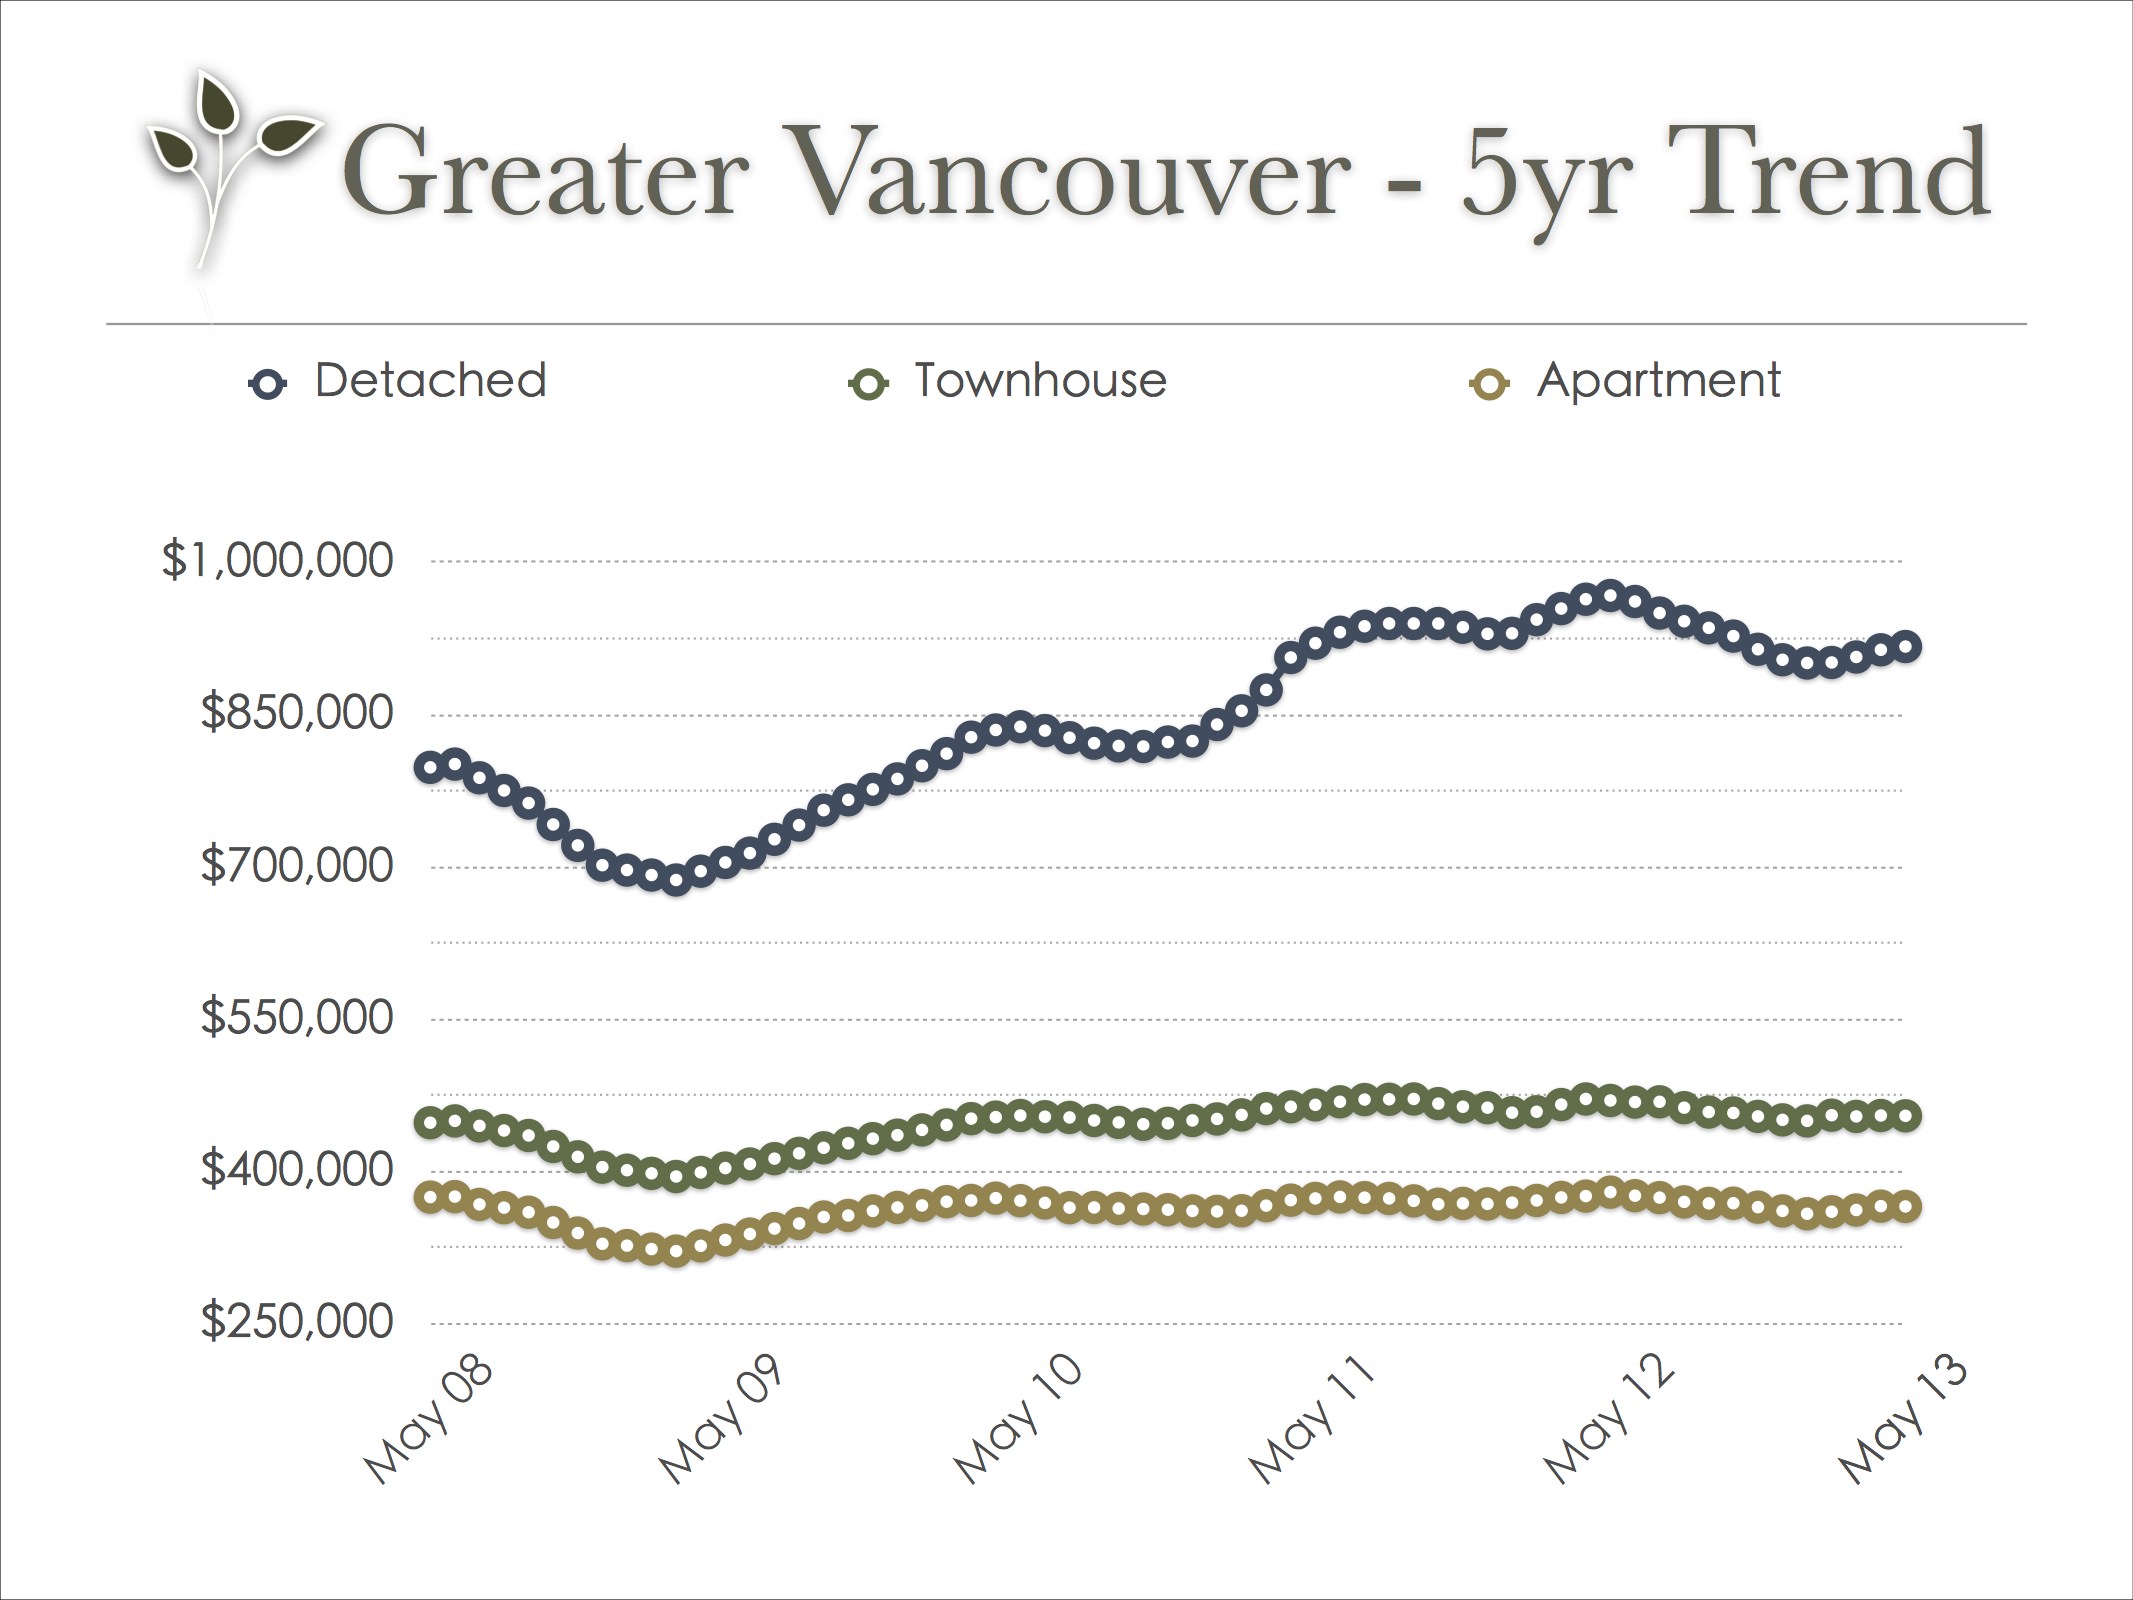
vancouver_real_estate_trend_may_2013Stats are provided by the Real Estate Board of Greater Vancouver; feel free to view the complete REBGV Stats Package for May, 2013 on their website.

2,947 Views, 0 Comments